

How we go about estimating casualties in Syria—Part 1

Figure 17 from report on Syria by Price, Klingner and Ball (2013, p. 27): Documented Killings by Month and by Number of Sources
I spent the two weeks over Easter working with Patrick and Megan in San Francisco, trying to figure out a strategy of how best to estimate the number of casualties the Syrian civil war has claimed in the past two years. In January, HRDAG published a report on the number of fully identified casualties reported in the Syrian Arab Republic between March 2011 and November 2012. The number of de-duplicated records of killings for this period was 59,648, a number that is likely to be an undercount since we know that many incidences of lethal violence in conflict go unreported, and that the unreported cases are not missing at random.
At HRDAG, we spend most of our time trying to figure out what the undercount of killings in conflict looks like, and how we can estimate it in a reliable way. Since we have matched multiple lists of victims for the Syrian conflict, we can perform multiple systems estimation. The first step in this process is called stratification.
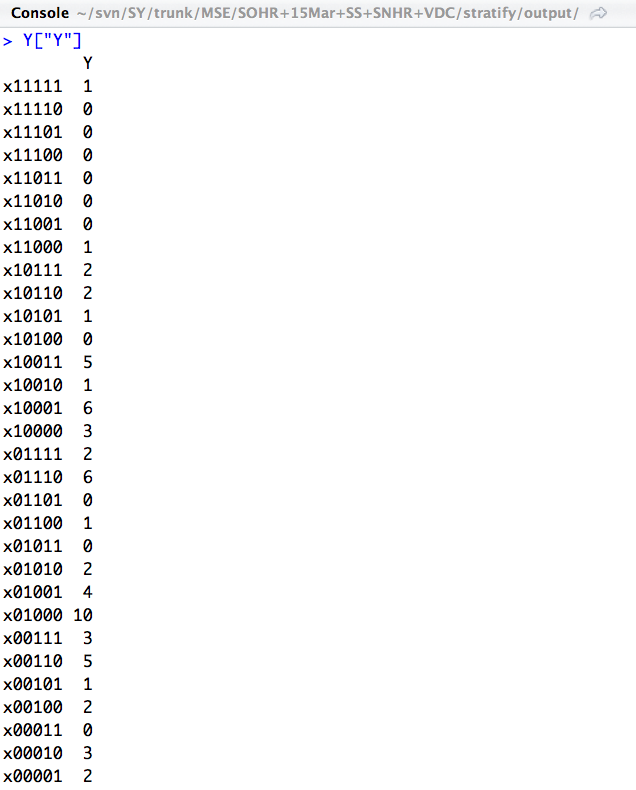
This is what a stratum for five lists looks like that can be used for multiple systems estimation.
For the Syrian case this means that we divide up the recorded killings by different time periods and governorates, so that we get lots of small data ‘portions’. Each portion of data then entails information on the number of reported killings at a given time in a given governorate, and – importantly – tells which sources reported these killings. These sources are human rights groups that have been collecting information on killings in Syria for the last two years, such as the Violations Documentation Center in Syria or the Syrian Revolution Martyr Database[1]. Some of the killings appear in all of the groups’ records, while some are just recorded by one or a few. We call this the overlap information between the different data sources, because it tells us exactly how many times the same incident was reported across the different lists we received from groups collecting this data. This overlap helps us determine the probability that the killing of a person was not reported in any of these lists. You can read more about the statistics behind this approach here.
Intuitively, however, it makes sense that the probability of a killing being reported is dependent on where and when it happened. Did it happen at the beginning of the conflict? Or in a period where lots of other killings happened? Or was it an isolated case? And did it happen in the capital, where lots of reporters witnessed it? Or did it happen somewhere far away from the front lines where no one was paying attention? As you can see, all of these factors (and many, many more) are likely to affect the capture probability of an incident – the probability of a killing being reported – or not being reported. Dividing up the data into small portions, or what we call strata, helps us control for heterogeneous capture probabilities and interdependencies between lists. For example, a stratum might cover all killings that occurred in Damascus in the first two weeks of April 2012. Another stratum will cover all killings that occurred in Aleppo in the first two weeks of April 2012. And so on.
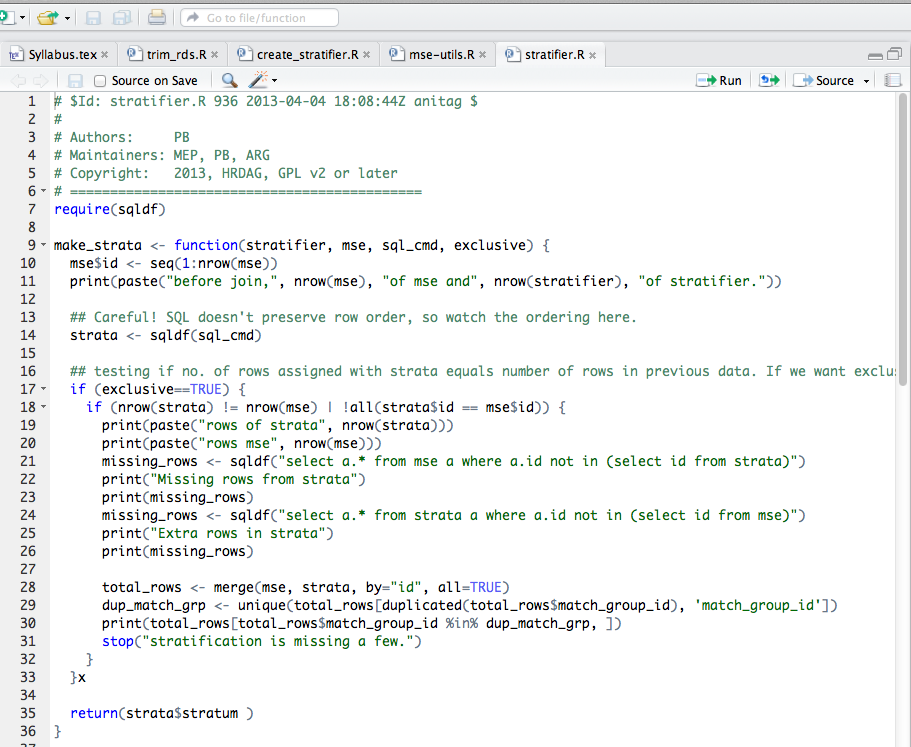
Some R code we wrote to stratify the data in a semi-automated way. The input needed is the de-duplicated list of killings and the parameters of the strata.
So why is stratification so hard? Because we want to make sure that our estimation of the undercounted killings is as accurate as possible, we want to be absolutely sure that the strata we create are as homogenous as possible. We know that the more fine-grained our strata are, the more likely it is that they will be homogenous – or at least less heterogeneous. We have to, however, keep in mind that a stratum still needs to have enough overlap between different lists for the multiple systems estimation to work.
In Syria, we are working with up to five lists, which means that 32 different overlaps are possible[2][3]. In mathematical notation, we use ‘x11111‘ as shorthand for killings that are present (‘1’) in all five lists. For example, some killings will be reported in in the first four lists (x11110), some in the last two (x00011), some in the first and the last list (x10001), and so on. While we don’t need to have cases for all of these 32 overlap possibilities, we do need a minimum number of about half of the overlaps for the estimation to work. If the number of overlaps is too small, we speak of strata that are too sparse, which essentially means we are feeding our estimation model too many zeros.
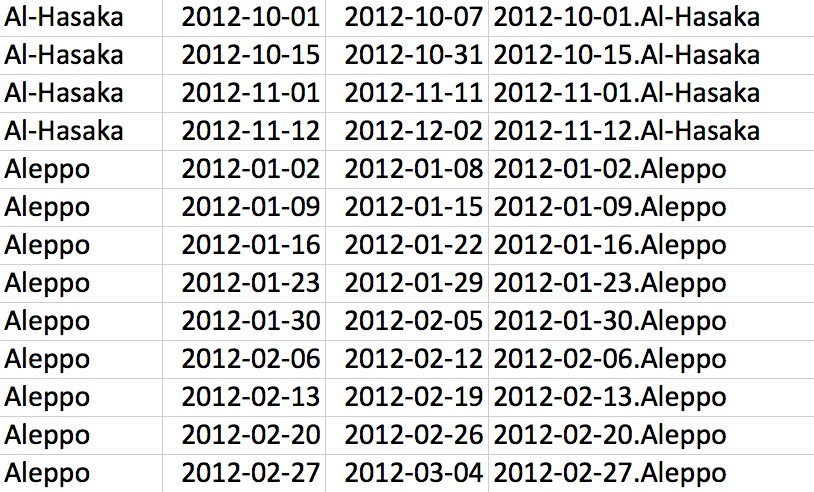
Figuring out the right start and end dates for strata in Syria.
It comes as no surprise that the number of reported killings in the Syrian conflict vary strongly over both time and governorates, which means that the size of the strata varies strongly as well. For governorates and time periods where there was intense fighting, we can create strata that are almost at a daily level — which means that for these strata, we can estimate the undercount of killings at a daily level. In other governorates, we create one stratum per week, per month, and sometimes even for three or four months at a time. It all depends on the number of reported killings, and the overlaps between the sources. The density and overlaps in reported cases thus directly translates into the size of the strata the can be created. And the strata then determine which time periods per governorate can be estimated individually.
So we spend a great deal of time trying to figure out the perfect stratum size: one that is as homogenous as possible, and still dense enough to be used for multiple systems estimation. This is the only way we can make sure that the estimates we derive from these strata will be as accurate as possible.
[1] Our data sharing agreements with the individual groups precludes us from making the full dataset publicly available. We are linking to the Violations Documentation Center in Syria and the Syrian Revolution Martyr Database because they are publicly available. We do not endorse these groups to be more reliable than the other data sources we include in our study. [2] In the report we published in January seven groups were included in the analysis. Due to different coverages we only include five of the seven lists in our estimation. [3] Although we have now as many as nine separate lists (depending on how you count them), only five have sufficiently wide coverage across time and governorates to be used in our MSE. [Creative Commons BY-NC-SA, excluding images]